Message Sent Successfully!


Scholastic Aptitude Test - Result Declaration-Validity, Exam Cut Off,
Result Declaration-Validity
The SAT score is determined on a scale of 400 to 1600, with EBRW and Math included. The SAT's two components (EBRW and Math) are each graded on a range of 200 to 800. The entire SAT score is made up of the EBRW and Math parts. Because there are no penalties for incorrect answers, candidates are given a raw score based on the total number of correct responses. The average SAT score in the United States is 1000. The average SAT score required for admission to top universities is 1350 or higher. Candidates will receive their SAT test results anywhere from two to six weeks after taking the exam. The validity of a SAT score is five years. If a candidate chooses to write an essay, they will obtain an optional SAT essay score. In 2021, the average SAT score will be about 1000. Candidates with SAT scores of over 1200 are deemed to have strong SAT scores. A 1600 SAT score is the highest possible.
SAT Score Range
SAT total score is formed by adding SAT Math and EBRW. The main two sections – Math and EBRW are marked out of 800. The highest SAT score possible in Math and EBRW is 800.
|
Section |
Lowest SAT score |
SAT Max score |
SAT score range |
|
SAT math |
200 |
800 |
200-800 |
|
SAT evidence-based reading and writing |
200 |
800 |
200-800 |
|
Total SAT score (Sum of 2 sections) |
400 |
1600 |
400-1600 |
|
SAT Essay Score (optional) |
2 |
8 |
2-8 |
|
Test Scores – Reading, Writing and Language, Math |
10 |
40 |
10 – 40 |
|
Cross-test Scores – Analysis in History/Social Studies and Analysis in Science. Based on selected questions in the Reading, Writing and Language, and Math Tests. These skills examine the problem-solving abilities in these specific subject areas. |
10 |
40 |
10 – 40 |
|
Subscores – Reading and Writing and Language: Command of Evidence and Words in Context. Writing and Language: Expression of Ideas and Standard English Conventions. Math: Heart of Algebra, Problem Solving and Data Analysis, and Passport to Advanced Math. |
1 |
15 |
1 – 15 |
• The SAT composite score ranges from 400 to 1600 on a scale of one to ten. This is also known as the SAT total score, according to the SAT scoring definitions.
• The highest SAT score, or maximum SAT score, is 1600.
• The SAT syllabus includes evidence-based reading, writing, and mathematics, each with a 200-800 SAT scoring range.
• The SAT evidence-based reading and writing score is the sum of the SAT writing and reading scores. The core range for each of these divisions is 10-40.
• An optional essay element with a score range of 2-8 is available.
• A Cross-test score is a part of the SAT score report that looks at problem-solving skills. It is graded on a scale of 10 to 40.
• A subscore is a component of the SAT score report that assesses specific topics such as evidence command, English conventions, math, and more. It is based on a scale of 1 to 15 on the SAT.
What is the Minimum SAT score, Harvard?
Harvard's SAT scores vary from 1515 to 1600 on a scale of one to six. Harvard's average SAT Math score goes from 740 to 800, while its EBRW score is from 720 to 780.
What is the Hardest College to Get Into?
The universities with the lowest admission rates are generally the most difficult to get into. Harvard, MIT, Stanford, California Institute of Technology, and Yale are among the few colleges with a low admittance percentage based on College Board SAT scores. This is because, even with months of preparation, most candidates will struggle to get SAT scores above 1510.
SAT Mean Score
The graph below depicts the average SAT scores from 2017 to 2020. This graph depicts the evolution of SAT scores throughout time. With a score of 1081, the average SAT score in 2020 is the highest among the prior years.
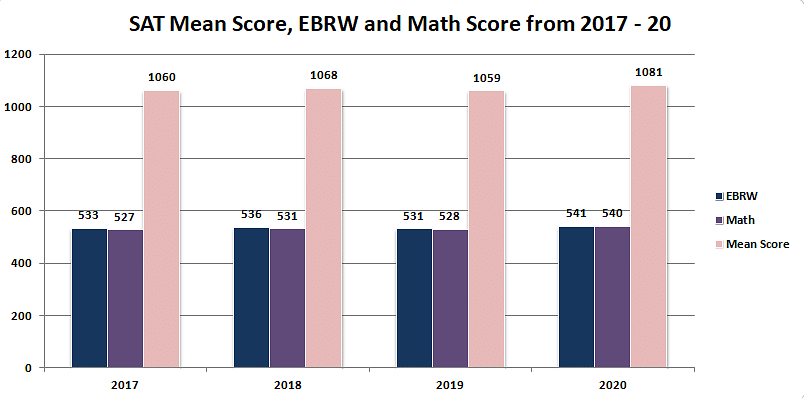
• In 2017, there were 1,715,481 SAT test-takers, and the SAT mean score or average SAT Score, as provided, was 1060 out of a total score of 1600; in 2018, there were 2,136,539 SAT test-takers, a 25% increase over the previous year.
• In 2019, there were 2,220,087 SAT test-takers, with a mean score of 1059, indicating a little decrease; Despite the epidemic, the year 2020 saw the highest SAT score of 1081. EBRW and Math SAT scores are also higher than they were three years ago.
According to this graph, Harvard SAT scores, MIT SAT scores, and Stanford SAT scores are all significantly higher than the average SAT score, implying that candidates must have exceptional SAT preparation to attain such scoring criteria.
SAT Score: Based on Gender
Gender ratios and how performance levels change can be researched using SAT scores. Let's have a look at the graph to see what we're talking about:
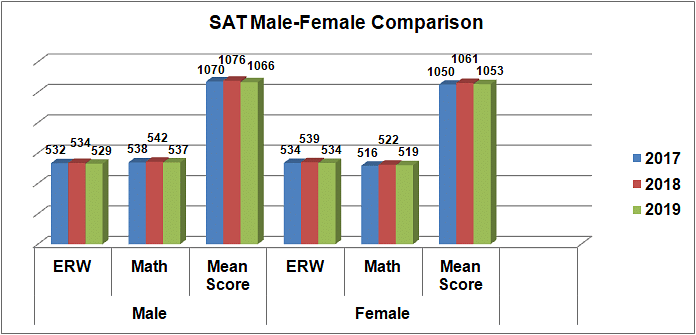
According to the graph above, 2018 had the highest mean score for both men and women, with scores of 1076 and 1061, respectively.
SAT Score: Based on Intended Majors
The graph below depicts a handful of the most well-known intended majors among SAT aspirants, as well as SAT average scores.
|
Most Intended College Majors |
Mean Score (2019) |
Percent |
|
Health Professions and Related Clinical Science |
1048 |
18% |
|
Business, Management, Marketing and Related |
1072 |
12% |
|
Biological and Biomedical Sciences |
1139 |
8% |
|
Visual and performing arts |
1045 |
7% |
|
Security and protective services |
975 |
4% |
|
Engineering |
1139 |
11% |
|
Psychology, General |
1064 |
4% |
|
Education |
1022 |
4% |
SAT Score Calculator
The SAT total score is determined by the SAT math score and the SAT EBRW. To get a SAT score, you must first calculate the raw point of SAT math, also known as SAT EBRW. The number of correct answers submitted by the candidates equals the raw SAT score. It's important to understand that there is no such thing as a SAT passing score. Candidates must meet the SAT cutoff requirements for the colleges they wish to attend. The SAT raw score calculation is as follows:
|
Section |
Number of questions |
SAT Raw score |
|
SAT math |
58 |
58 |
|
SAT reading |
52 |
52 |
|
SAT writing |
44 |
44 |
There is no negative grading on the SAT scoring system, and each question is worth one point. To calculate a SAT score, the received SAT math raw score is directly translated to a SAT math score on a scale of 200-800. The entire SAT score is derived using this score. To get SAT evidence-based reading and writing scores, the raw reading and writing scores are transformed independently on a scale of 10-40 and the sum of these two SAT score scales is multiplied by 10. The total SAT score attained by a candidate is the sum of the SAT math score and the SAT evidence-based reading and writing score.
SAT Score Chart
Although the SAT score computation method is complex, candidates might have a better understanding of it by using this SAT score chart.
|
Raw Score |
Scaled Math Score |
Equivalent Reading Score |
Equivalent Writing & Language Score |
|
0 |
200 |
10 |
10 |
|
1 |
200 |
10 |
10 |
|
2 |
210 |
10 |
10 |
|
3 |
230 |
11 |
10 |
|
4 |
240 |
12 |
11 |
|
5 |
260 |
13 |
12 |
|
6 |
280 |
14 |
13 |
|
7 |
290 |
15 |
13 |
|
8 |
310 |
15 |
14 |
|
9 |
320 |
16 |
15 |
|
10 |
330 |
17 |
16 |
|
11 |
340 |
17 |
16 |
|
12 |
360 |
18 |
17 |
|
13 |
370 |
19 |
18 |
|
14 |
380 |
19 |
19 |
|
15 |
390 |
20 |
19 |
|
16 |
410 |
20 |
20 |
|
17 |
420 |
21 |
21 |
|
18 |
430 |
21 |
21 |
|
19 |
440 |
22 |
22 |
|
20 |
450 |
22 |
23 |
SAT Score Calculation Measures
A rigorous process is used to calculate SAT scores, ensuring security and impartiality in the process. To provide an unbiased and perfect SAT score, College Board employs a number of techniques.
• Secure delivery: When the test is completed, the papers are held on the check until it is transported to the processing centre.
• Scanning Method: The answer sheets are evaluated by the system, which calculates the accuracy of the marked circles. Because there is no penalty for guessing, the raw scores finally equal the exact number of answers;
• Maintaining Correctness: To maintain accuracy, double-scanning and alignment testing are performed on all papers. To assure correctness on your end, follow these steps:
o Use a No. 2 pencil and a soft eraser instead of a mechanical pencil;
o Use a No. 2 pencil and a soft eraser instead of a mechanical pencil;
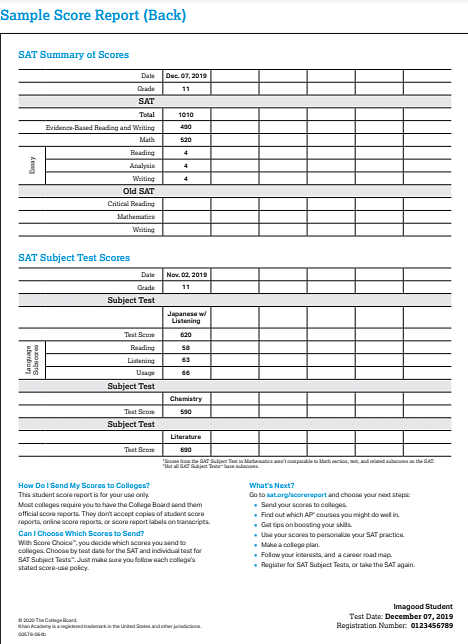
SAT Score Report
By checking in to the official website, candidates can obtain their official SAT score report. Let's look at the SAT grading scale in the SAT score report in detail to better comprehend the SAT score:
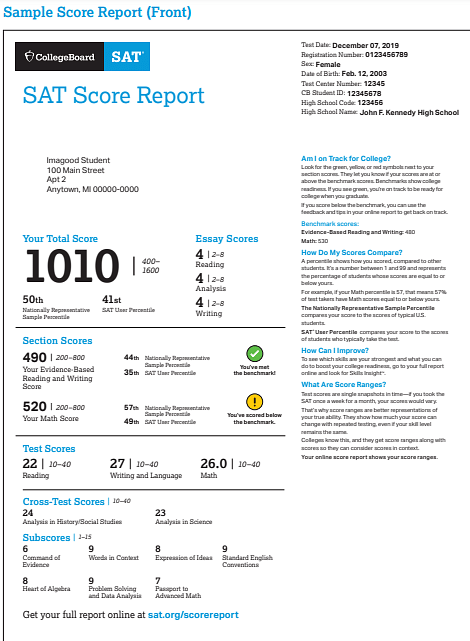
The SAT score report shows the subscores, test scores, and cross-test scores for each section of the exam. Each part assesses a distinct set of abilities.
•Out of a total of 40 points, two cross-test scores are calculated. The candidate's understanding of history and social studies is examined. Both the EBRW and Math sections contain the questions.
•The subscores in the SAT score report provide information about the candidates' various skill sets. Subscores in the Math part assess algebra, problem-solving, data analysis, and a passport to higher mathematics. Subscores in the EBRW assess Expression of Ideas, Standard English Conventions, Words in Context, and Evidence Command.
What is a Good SAT score?
The SAT score report shows the subscores, test scores, and cross-test scores for each section of the exam. Each part assesses a distinct set of abilities.
•Out of a total of 40 points, two cross-test scores are calculated. The candidate's understanding of history and social studies is examined. Both the EBRW and Math sections contain the questions.
•The subscores in the SAT score report provide information about the candidates' various skill sets. Subscores in the Math part assess algebra, problem-solving, data analysis, and a passport to higher mathematics. Subscores in the EBRW assess Expression of Ideas, Standard English Conventions, Words in Context, and Evidence Command.
SAT Score Percentiles
The SAT percentiles will show you where you rank in relation to the rest of the people who took the test. The SAT percentile tells you what proportion of other candidates scored the same as you or higher. If you have an 80 percent percentile score, for example, you have outperformed 80 percent of the test participants.